WinAntiDbg0x300 (rev) – CTF Write-up
Challenge Overview
We’re given WinAntiDbg0x300.exe, a Windows GUI application worth 400 points in picoCTF 2024. The goal is to debug the binary and recover the flag, but this time the program actively fights the debugger.
- A UPX-packed executable that requires administrator privileges
- Anti-debugging checks that interrupt the normal execution path
- A worker thread containing the route to the flag
- Process state matters; careless changes can corrupt the result or terminate the debugger
Initial Reconnaissance
Loading the executable in IDA reveals that it is packed with UPX. Before following the application logic, we unpack it into a separate file:
upx -d WinAntiDbg0x300.exe -o original.exe
We then load original.exe into IDA. The unpacked binary gives us the application’s functions and control-flow graphs to work with.
The first debugger run ends with a message:
Oops! Debugger Detected. Challenge Aborted.
Following the reference to that string leads to the first useful branch. Immediately before the error path, the program tests EAX and conditionally jumps away from the abort message.
Static Analysis
The First Check
The relevant basic block is labelled loc_4027C6 in the screenshots. Its final instructions are:
test eax, eax
jz   short loc_402802
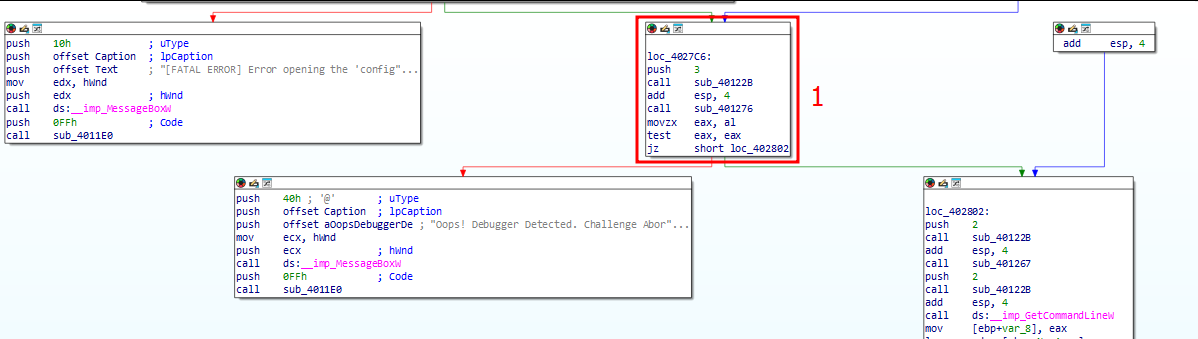
test eax, eax updates the flags without changing the register. If EAX is zero, the result is zero and ZF is set. The following jz takes the branch to loc_402802 when ZF is set.
During the debugger run, EAX is 1 at this check. That leaves ZF clear and execution falls through to the error message.
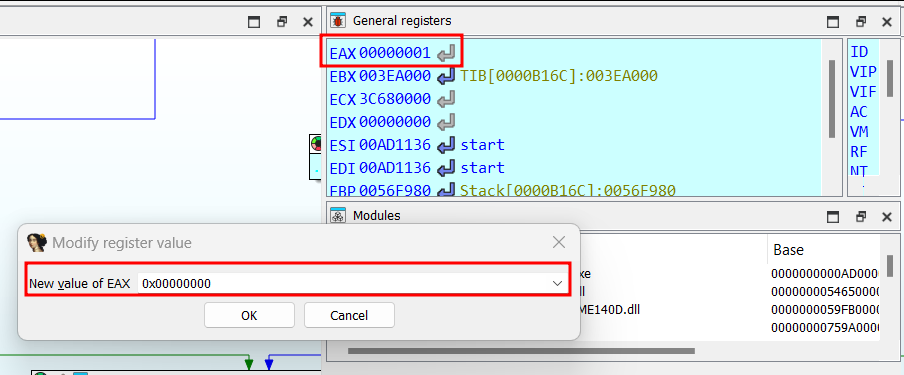
The breakpoint therefore belongs on the test instruction. Changing EAX to 0 before that instruction executes lets the instruction calculate the flags for the intended branch.
Thread Creation
The continuation eventually reaches CreateThread. Its start-routine argument points to StartAddress, which is where the worker thread begins executing.
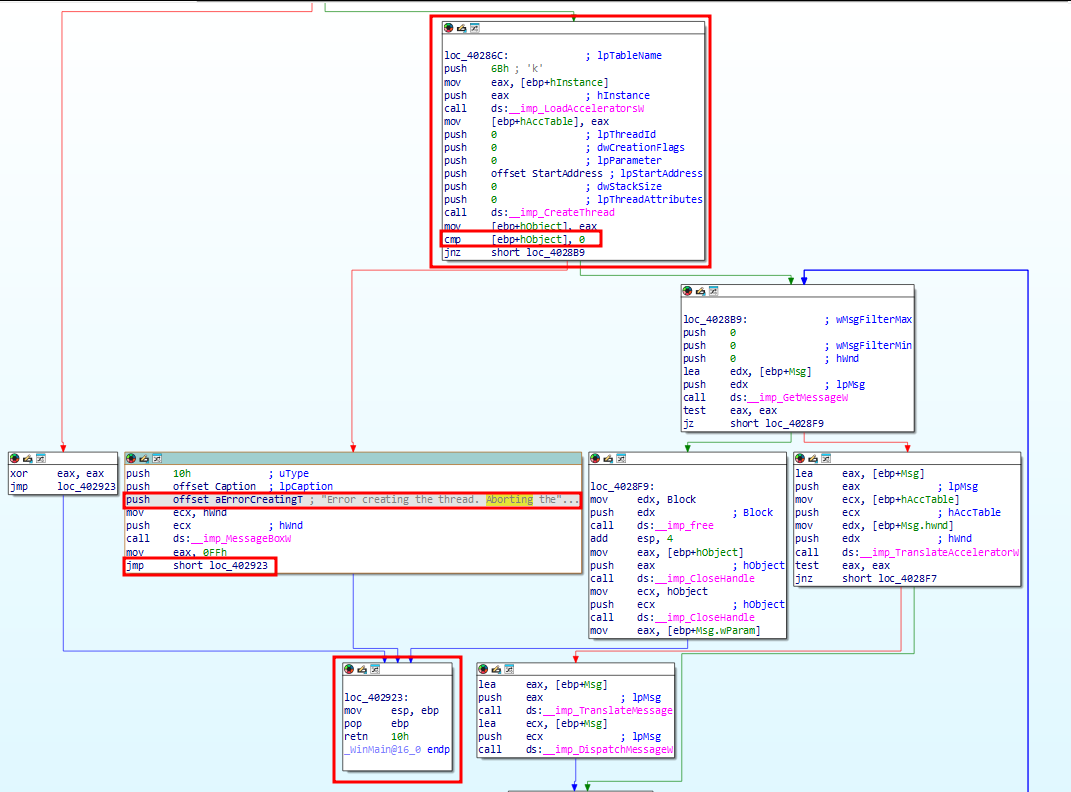
After the call, the returned handle is stored in [ebp+hObject] and compared with zero. The screenshot shows jnz short loc_402889: a nonzero handle takes the success branch, while a zero handle leads to the thread-creation error.
This check has a different meaning from the earlier anti-debugging branch. A zero value is useful at the first test, but a zero thread handle indicates failure. We need to follow what each value represents rather than apply the same change everywhere.
Dynamic Analysis
The First Attempt
We set the first breakpoint and change EAX from 1 to 0. The initial attempt still terminates the program and IDA unexpectedly.
That observation alone does not establish that thread creation failed. After reopening IDA, we follow the worker thread’s StartAddress routine to understand the remaining execution paths.
The Worker Thread
The thread’s graph contains a second branch at loc_4037C0. In the supplied disassembly, it looks like this:
mov  eax, 1
test eax, eax
jz   loc_4038E0
The branch to loc_4038E0 leads toward code that prepares the flag text. A later block, loc_403929, contains the message-box call associated with the success message.
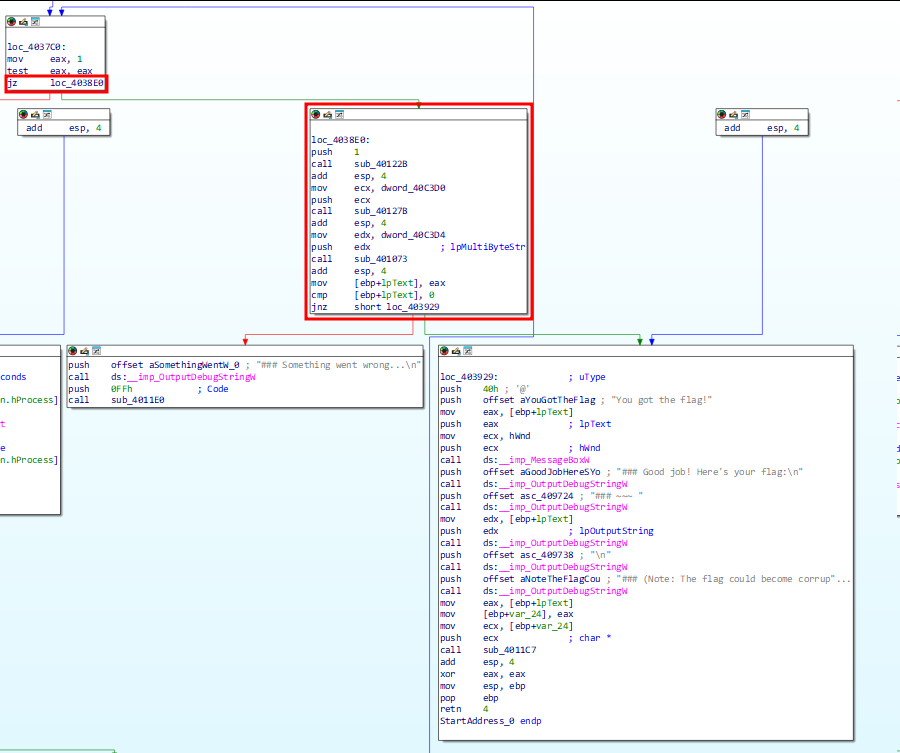
We now have two relevant checks to observe:
| Location | Instruction | What we change |
|---|---|---|
loc_4027C6 |
test eax, eax |
Set EAX to zero before the test executes |
loc_4037C0 |
test eax, eax |
Set EAX to zero after the preceding assignment |
The second breakpoint is on test, not on the preceding mov. Otherwise that assignment would overwrite the register change before the condition is evaluated.
Following the Flag Path
With both breakpoints in place, we start debugging again. At the first check, we change EAX to zero and continue. When the worker thread reaches the second check, we make the same register change there.
This time execution reaches the success path and displays the flag.
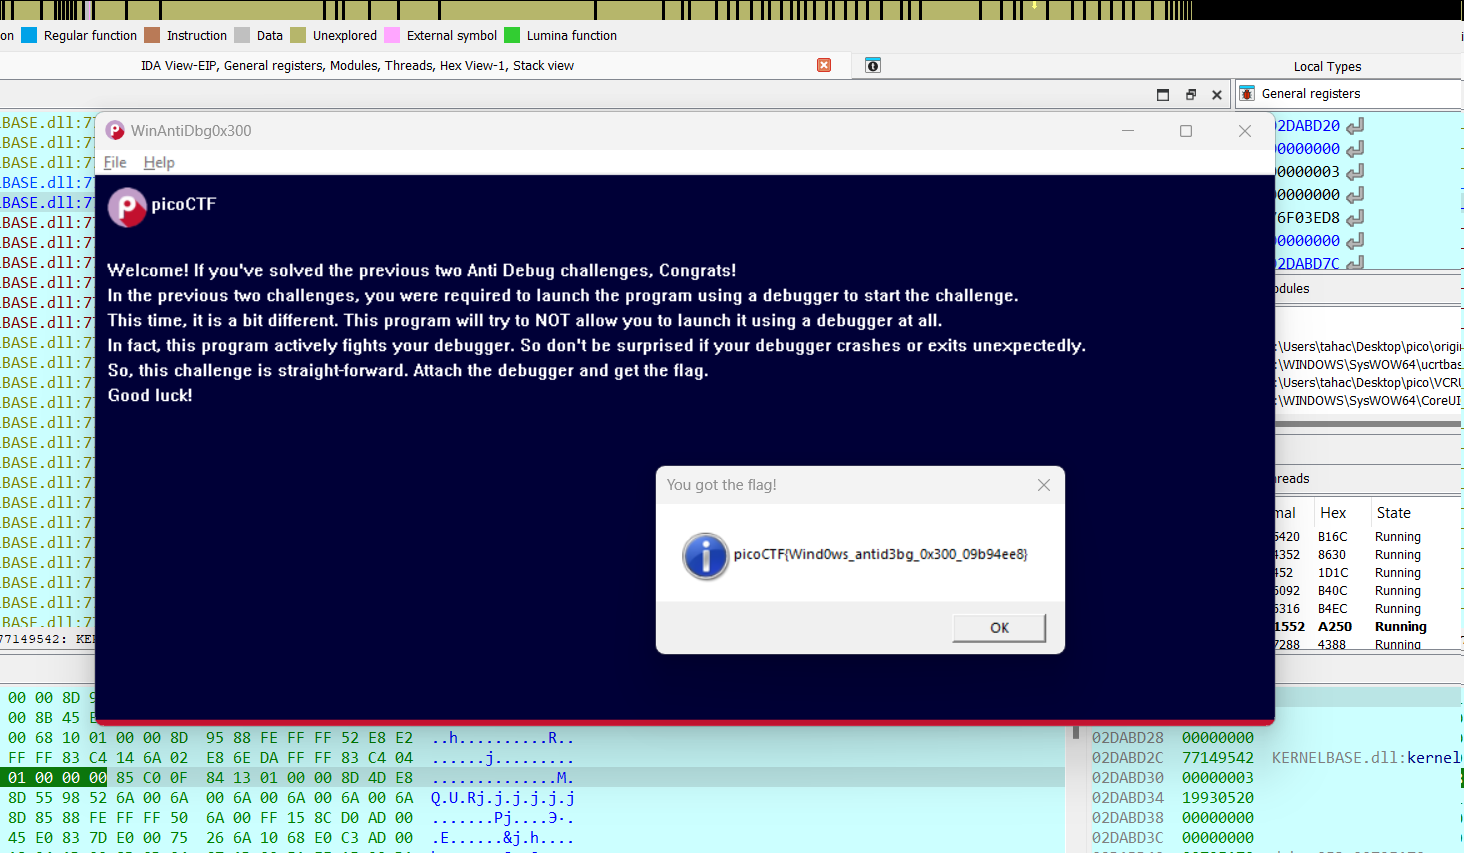
picoCTF{Wind0ws_antid3bg_0x300_09b94ee8}
Key Takeaways
- Unpack the executable before spending time following the packer’s control flow.
- Trace an error message back to the condition that selects its path.
- Read the instruction and its flags together;
JZandJNZtake opposite branches. - Follow thread entry points as well as the main execution path.
- Modify the smallest amount of state needed and check which instructions execute next.